Classroom Keystage 1-Maths - Handling Data
|
Picture graphs - favourite snacks
Classroom Keystage 1-Maths - Handling Data |
|
Sweets and Snacks Graph. 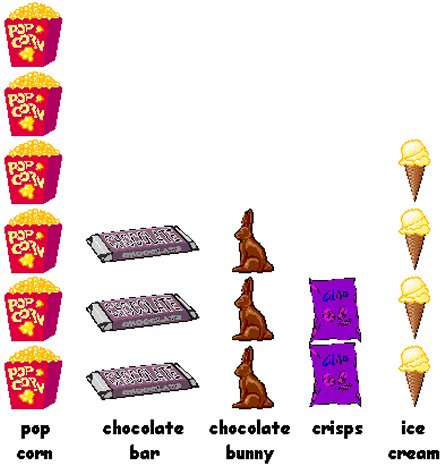
2. How many children liked crisps the best? [, 3, 1, 4, 2, ] 3. How many children were asked about their favourite and snacks? [, 19, 18, 14, , ] 4. Which was the least popular snack? [, crisps, chocolate bunnies, ice cream, ] 5. How many more children liked pop corn than ice cream? [, 4, 2, 3, 1, ] 6. How many more children liked ice cream than crisps? [, 3, 2, 4, 6, ] 7. How many children liked chocolate bars best? [, 2, 3, 4, 1, ] 8. How many children liked pop corn and ice cream altogether? [, 9, 11, 10, 8, ] 9. What is the difference between the pop corn and crisps? [, 3, 5, 4, 2, ] 10. Did more people like ice cream or chocolate bunnies? [, ice cream, chocolate bunnies, ] |